Summary
Every time the Fed announces monetary easing of some kind, we are flooded with questions and fear regarding inflation. You can also see a similar amount of interest when looking at Keyword searches on Google:
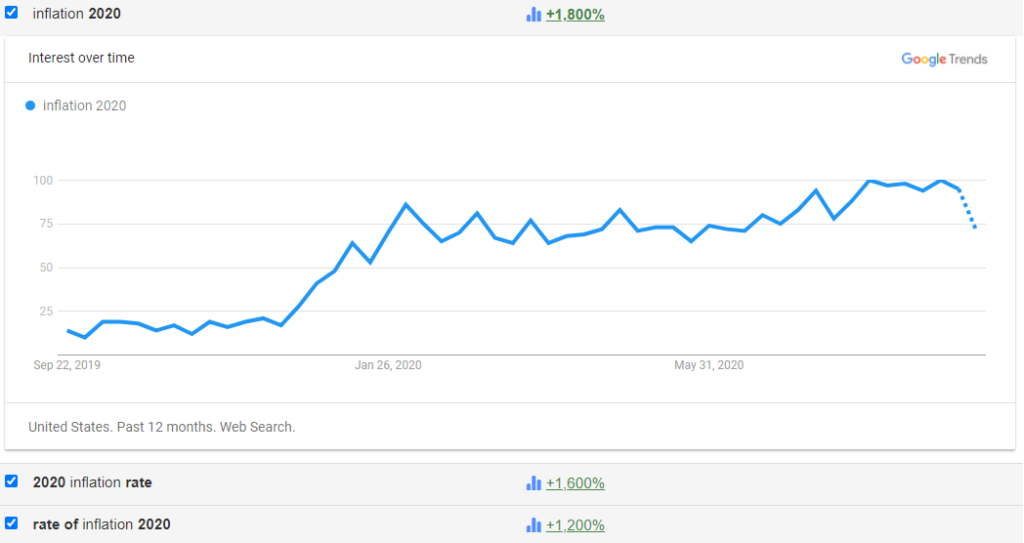
We believe that most of the public and even many investment professionals in the US lack an understanding of the cause and effect of monetary policy and resulting inflationary forces.
The goal of this article is to:
- Explore inflation, money velocity, interest rates, and their historical statistical relationships
- Explain, educate, and inform with quantitative analysis of historical data sets.
- Discover and interpret why we are currently in a low inflation regime, even with the Fed’s monetary policies over the past decade
- Examine where we are today, and what the future may hold, as well as identifying some of the key inputs to inflation (CPI) so readers can better digest data as it comes in.
- Finally, provide resources that may be of use for the reader to stay up to date with regards to inflation?
Full disclosure: I am not an Econ PhD and most of the algorithms and analysis presented here was originally sourced from fecon235 and adapted to reflect current data. Rather than re-invent the wheel, I start my analysis by searching resources provided by academics and folks much smarter than myself. It gives me a blueprint for a successful and analysis using the best practices I can get my hands on.
“fecon235 provides an interface for financial economics to the Python ecosystem, especially packages for mathematics, statistics, science, engineering, and data analysis.”
The notebooks provided below were originally sourced from https://github.com/rsvp/fecon235 and updated/modified to work with today’s data (the original notebooks are several years old and required some updates, but the original framework is still present). All of the links to notebooks presented below allow you to launch in Google Colab, which is a free service provided by Google to share and run data analysis notebooks. If you use one of the links below, simply hit the “Open in Colab” button at the top to be able to run the code and analysis yourself, otherwise you can view them using the links below.
Part 1: Inflation, money velocity, and interest rates
This notebook explores and tries to answer the question, “given the unprecedented amount of monetary policy and stimulus by the Fed, why have we not seen high inflation?”.
Without spoiling the analysis, the velocity of money and bond rates may have something to do with it. The velocity of money is the rate at which people spend money. Monetarist theory proposes that inflation occurs when too much money is available to buy the same amount of goods and services produced in the economy.
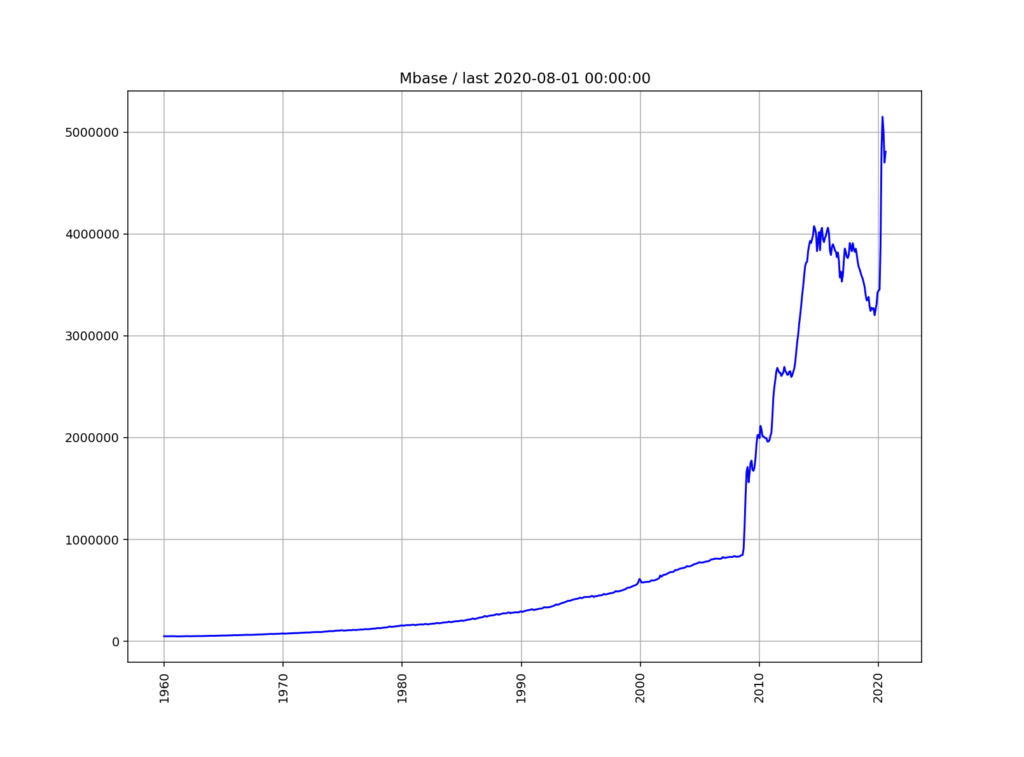
Under this theory, the US should have had around 31% annual inflation from 2008 to 2013, when GDP only grew by 2% while the money supply grew at a pace of roughly 33% annually. The amount of goods produced barely increased, while the money supply expanded dramatically.
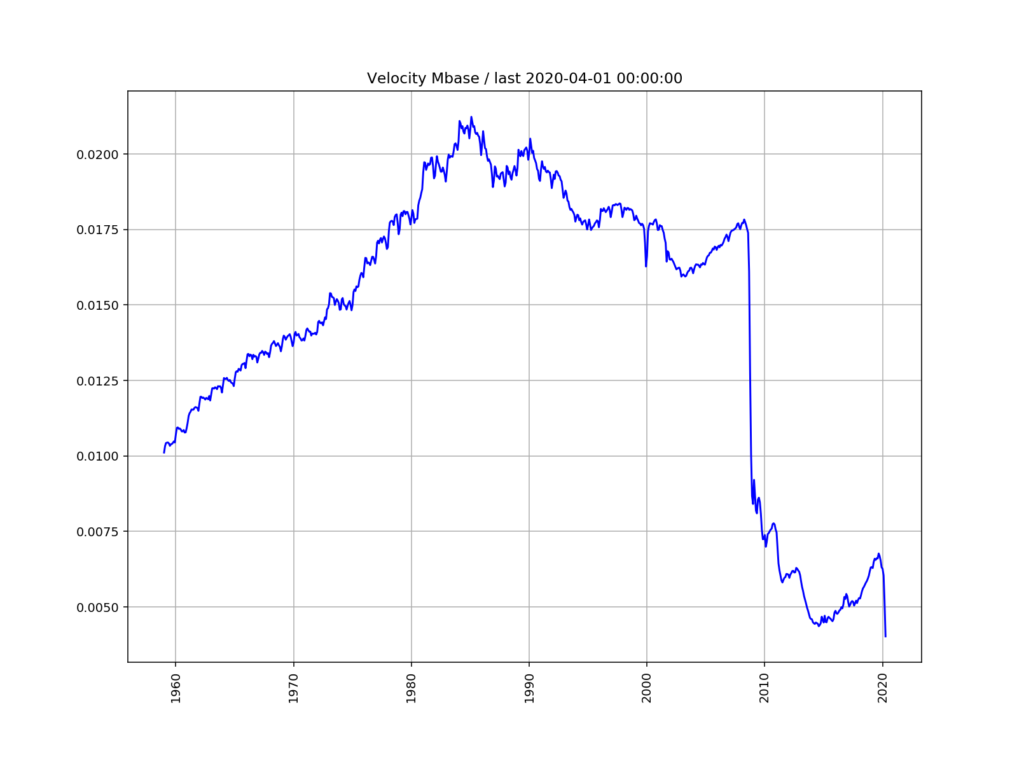
The explanation may lie in the fact that the velocity of money decreased dramatically in 2008 and has remained low through today.
Individuals and institutions are hoarding money rather than spending it, and banks have higher reserve levels than they had pre-2008 which consequently removes cash from circulation.
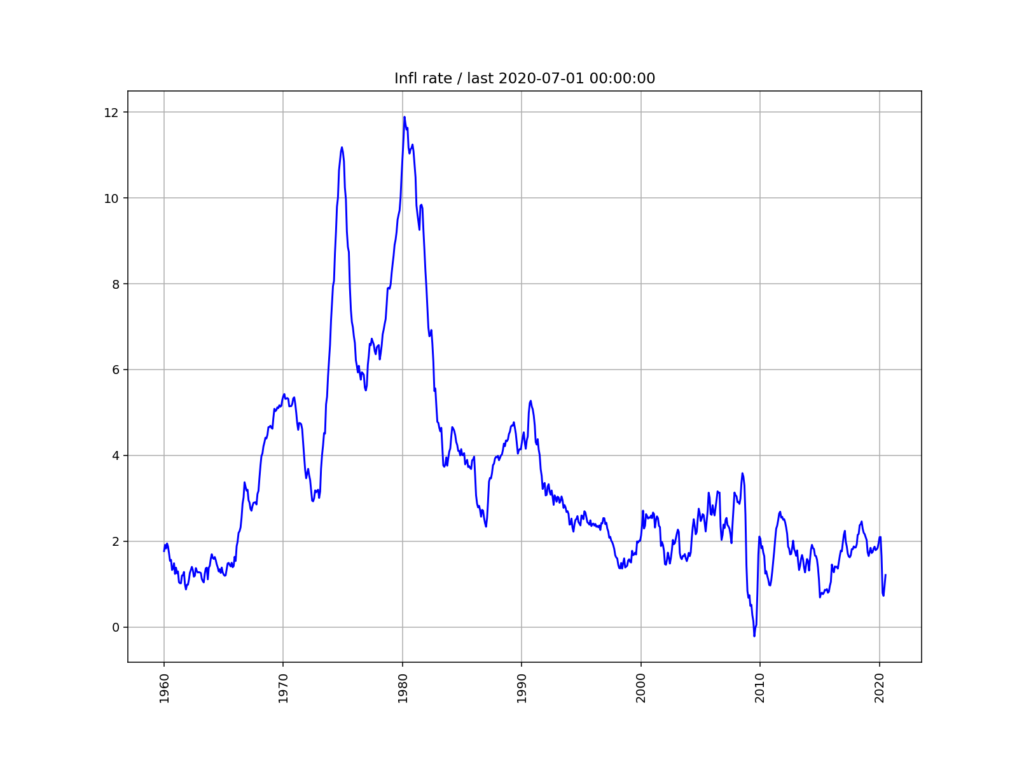
The historical velocity of money, inflation rate as measured by CPI, and money supply are shown below:
For a deeper dive and conclusion, I urge you to read through the notebook and explanations.
The notebook containing all the analysis, data and explanations is available here: https://github.com/aarongilman/research/blob/master/fred_infl_velocity.ipynb
Part 2: Analysis and Forecast of US Inflation
In this part of the analysis, we use current data to build a forecast for future inflation in the US. The methodology is relatively straightforward and averages 3 methods to arrive at a final output.
We used three non-related ways which characterized inflation:
- BEI, Break-even Inflation: a long-term forecast implied by the bond market
- Geometric mean rate: internal growth rate of a stochastic trend
- Holt-Winters model: projection obtained by robust prediction error minimization
Based on this model, the forecast ends up at 1.98% for the next 12-months.
Hardly what I would categorize as hyperinflation, but one could argue that the traditional measures of inflation are flawed, and that the rate of inflation is much higher if one constructed a new index – and I would agree. Undoubtedly, the argument has merit. Below, I present some alternative sources that can be utilized to gauge true inflation among consumers. However, given that this is a relatively new school of thought, not much exists around theory and formulas using this data, so it was not present in this analysis.
Overall, the idea with this piece was to help readers understand the dynamics and complexities of inflation and deflation relative to money supply.
The notebook containing all the analysis, data and explanations are available here: https://github.com/aarongilman/research/blob/master/fred_inflation.ipynb
Part 3: Additional Resources
- Introductory lectures on Quantitative Economics
- Inflation Dashboards
- Alternative measures of inflation (worth looking at but ultimately will not drive Fed policy)